
The Volume Profile indicator is a trading tool that allows you to see the distribution of trades in a given time period at each price level. It is a great complement to your usual charting indicators and can help you spot support and resistance levels that may be missed by standard trading tools.
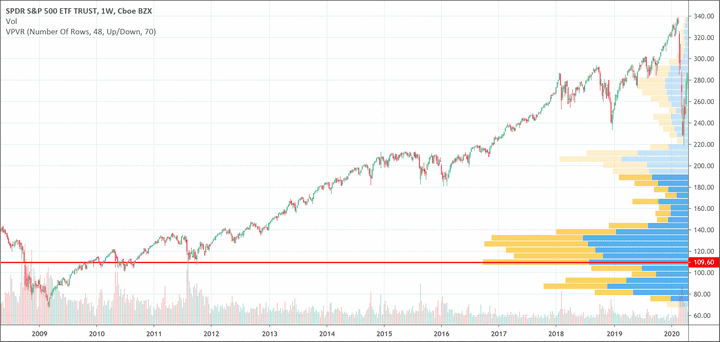
There are many different types of volume profiles, and each one has its own advantages and disadvantages depending on your trading style. The VPVR, or Volume Profile Visible Range, is the most basic type of volume profile and shows the volume traded at each price level automatically from your charts. Another type is the Volume Profile Fixed Range, which is similar to VPVR, but lets you set a specific range for your volume profile, and will only display the profile within that range.
A third option is the Volume Profile Overlay, which displays a volume profile on top of your regular price chart. This gives you a better idea of where big traders are looking to buy and sell and can lead to more profitable trades.
The main benefit of using a volume profile is that it allows you to see how much activity was there at each price level for the entire trading session. This information is important, as it helps you identify areas where a reversal could happen. It also provides useful information about how strong the volume is in those areas, which can give you a clue as to whether the market will be moving quickly or slowly.
Traders look at the volume profile to find high-value areas, which are areas where a lot of buyers and sellers have been concentrating their orders. These are often key support and resistance levels because heavy trading volume at a particular price level can act as a barrier to any further price movement in that direction.
On the other hand, low-volume nodes (which appear as valleys on the volume profile) indicate areas where less trading has been happening. These areas can sometimes be considered as unfair value areas, and the market is more likely to rally or break down from these areas than from other price levels.
The point of control (POC) is the price level with the highest amount of trading volume. It is often colored differently in the volume profile to make it easier to identify. The price range around the POC that contains 70% of the total value area is called the Value Area and is also often colored for ease of identification. The highest point in this price range is called the Value Area High, and the lowest point is called the Value Area Low. This information can help you identify potential reversal levels, which will give you a better chance of making successful trades.