
When you start doing more serious research, you will need to conduct a statistical test. It helps you to determine whether your hypothesis is significant or can be rejected. If you start browsing for statistical analyses online, you will find a large number of possible tests that can be chosen depending on your task. In this post, let us focus on a simple example of statistical analysis that would allow us to understand what is statistical significance and what is confidence interval.
Building a test scenario
To understand the matter, let’s use some random data which is distributed normally. For this, we can use 100 casual observations of the price tag for the new Nokia 3310 from different sources. The average price is around 50€ with a standard deviation of 10€
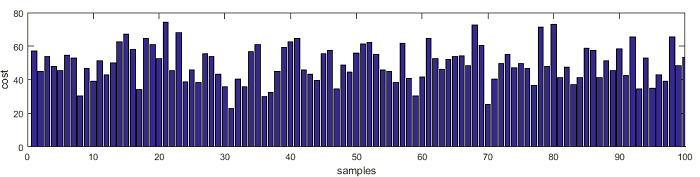
Now let’s plot how those samples are distributed along with the standard distribution graph:
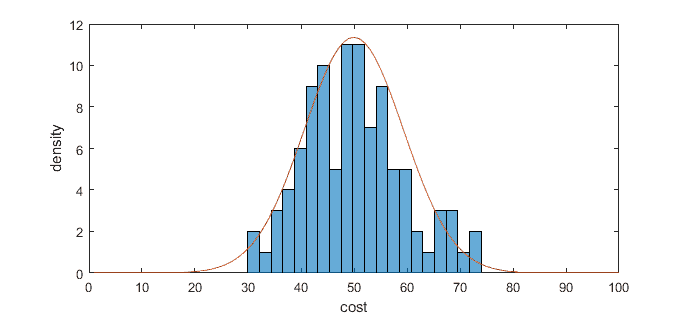
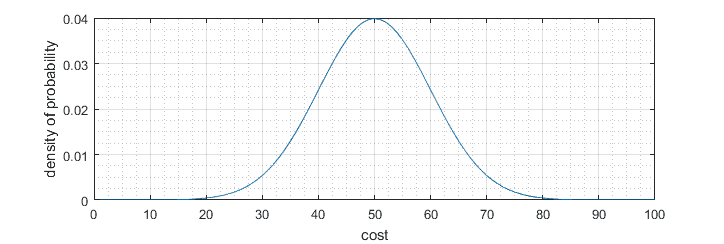
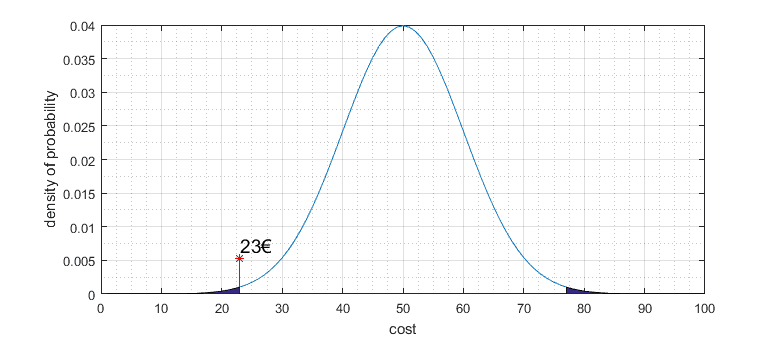
As you can see, the probability of distribution is Gaussian, with a mean of 50 and standard deviation 10. For later intuition, we will be using this Gaussian distribution expressed as probability density calculated by the formula:
We already know the mean and standard deviation from our data, so calculation and plotting become easy.
Now we can get back to the statistical test.
For the sake of simplicity, let us say after one a year, you decide to recheck the prices of Nokia 3310 and find that its average dropped to 23€.
Can we state that price is different? From first glance, it looks very different, but what if the collected data sample is different? What if you receive the exact size of the data sample and you get an average price closer to 50€? The statistical test helps to answer a question whether the price is significantly different from previous – in other words, is the sample mean significantly different from the null hypothesis? So how to draw a line where we can state that result is significantly different?
Significance level
To have some limits, we choose some significance level α, which indicates the risk that the difference exists even if there is no difference. Usually, this level is selected as α = 0.05. This means that there is a 5% probability of rejecting the null hypothesis. Humanly speaking, if we think that the average price of Nokia has dropped after a year, there is still a 5% probability that it’s not.
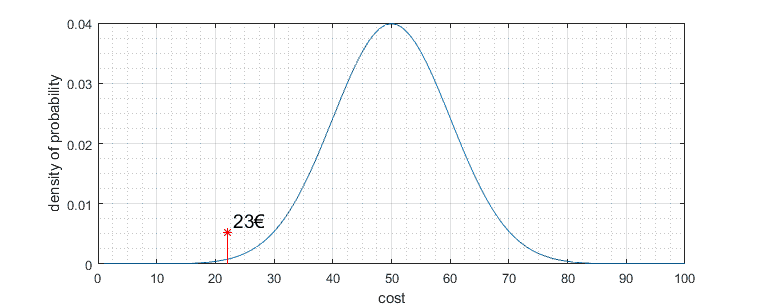
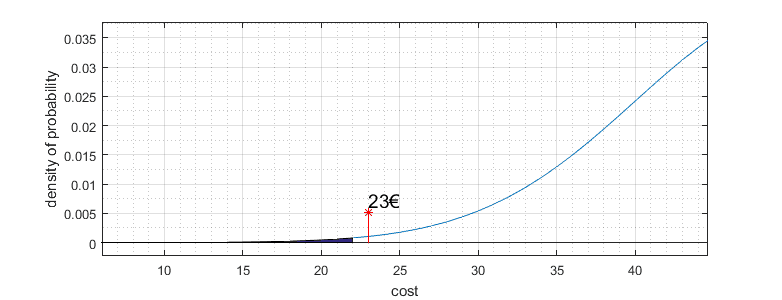
After we get significance level, we can draw those limits on distribution graph. On distribution graph Y axis represents probability distribution; we need to calculate the area under the chart to find actual probability limits. Since the diagram is double-sided, we need to split the 0.05 significance level to both sides, having 0.025 for each side. The total area under the graph is equal to 1. In zoomed graph portion, you can see that significance level is at a price around 22€:
Because price our observed price is 23€ doesn’t fall in this critical region, we must state that price didn’t change. So we cannot reject the null hypothesis of an average price being 50€. In other words, our observed average price of 23€ isn’t statistically significant to reject the null hypothesis. Significance level can be different; for instance, if we choose significance level α = 0.1, then definitely our observed new price will fall into the risky area, and so we could state that price changed significantly.
Probability value P
It seems that we have covered the basics, but there is still one more important thing to discuss – the P value. Practically speaking, P represents the probability of obtaining observed data (in our case price is 23€). So we need to find an area under the distribution graph up to point 23€. One side is 0.0023. Add both sides, we get 0.052 which is the value of P = 0.052.
Now we can rephrase our investigation. Comparing null hypothesis of Nokia’s price being 50€ to the recent observation of average price 23€, we find that probability P=0.052 of the cost is lower than significance level α = 0.05. So we state that we stick to the null hypothesis and say that price isn’t lowered than 50€. I hope this makes sense.
Final thoughts about the statistical significance
As mentioned before, the significance level isn’t a fixed value. Before you test your hypothesis, you must choose your level. The common ones are 0.05 and 0.01. You choose significance level with the thought of error rate that you reject the null hypothesis even if it is true. So P value and significance level help you to quantify the results of observation and control the error in the hypothesis test.
Sometimes instead of significance level, e.g., 0.05, you will find a notation of confidence interval equal 95% which is practically the same if you subtract 0.05 from 1, you get 0.95.
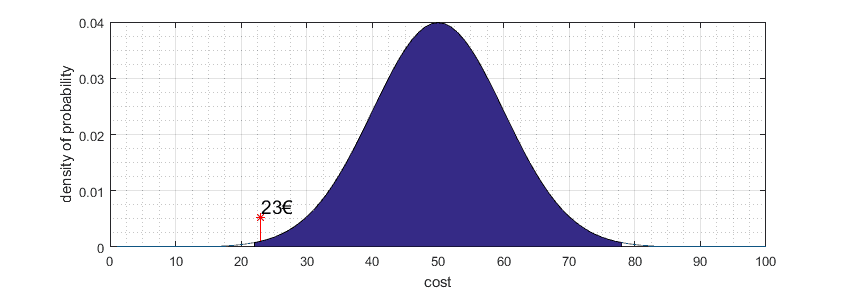
Confidence interval indicates uncertainty interval around null hypothesis point (50€) or, in other words, margin error.
You can play around with data above with this [Matlab live editor file.zip]