
Some time ago, I built a prototyping board with a graphical LCD. It has served for various small projects and prototypes. I had a spare temperature sensor DS18B20 and decided to put on a simple temperature display project. GLCD board is equipped with an Atmega32 microcontroller running at 16MHz. DS18B20 sensor is connected to port D pin 6.

LED connected to PD3 is used for indicating EEPROM write activity. The device is navigated with a rotary encoder. It is connected to MCU as follows (more about interfacing rotary encoder here):

As you can see hardware is simple considering that you already have a GLCD board. The next step is to decide what functionality is needed. I came up with the following:
- Temperature display with 0.01ºC resolution;
- Time display in HH:MM:SS format;
- Date display in YYYY:MO:DD format;
- The date is calculated with the leap year algorithm;
- Temperature is updated every 5s;
- Temperature data with date/time is sent to UART terminal;
- MIN and MAX temperature storage in EEPROM;
- Menu selectable functions: time/date set, temperature log view, graph plot, reset min-max, stats view;
- The LED blinks each time min or max is updated.
Reading DS18B20 sensor
Let’s go through all parts of this, first of all, temperature reading. As Atmega32 doesn’t have any hardware-level 1-wire support, everything has to be done in software. Luckily you can find ready libraries for this. As a reference, I’ve used a code example from here. The library combines several smaller ones that include a 1-wire and DS18x20 code developed by Peter Dannegger and a CRC code from Colin O’Flynn. All you need to initialize the sensor, read its ROM code, and access sensor data with a function that returns temperature value. The library supports multiple sensors connected to a single wire, so the main code could be simplified since we need to read only one sensor. We are leaving as it is as long as it works. Temperature is stored as three 8-bit values: sign, the integral part, and decimal part. This way, we avoid using floating-point numbers that would take a significant amount of resources.
Time and date calculation
The time and date track are software-based. This means that every second, minute, hour, day, month, and year must be calculated within the algorithm. To make one-second ticks, there is 16-bit timer1 used, which generates overflow interrupts. On every interrupt time and date update function is called that increments value by one second as follows:
void TimeDate_Update(void)
{
if (++TD.ss==60)
{
    TD.ss=0;
    if(++TD.mm==60)
    {
        TD.mm=0;
        if(++TD.hh==24)
        {
            TD.hh=0;
            if(IsLeapYear(TD.year)&&(TD.mo==2))
            {
                if(++TD.dd>SDays[0])
                {
                    TD.dd=1;
                    if(++TD.mo>12)
                    {
                        TD.mo=1;
                        TD.year++;
                    }

                }
            }
            else if(++TD.dd>SDays[TD.mo])
                {
                    TD.dd=1;
                    if(++TD.mo>12)
                    {
                        TD.mo=1;
                        TD.year++;
                    }
                }
        }
    }
}
It also takes care of leap year calculation. It means if the year is a leap, then February has 29 days; otherwise, it has 28. Leap year algorithm is common and can be found on the internet:
uint8_t IsLeapYear(uint16_t year)
{
if ((year % 4) == 0)
{
    if ((year > 1582) && ((year % 100) == 0))
    {
        if ((year % 400) == 0)
        return 1;
        else return 0;
    }
    else return 1;
}
else return 0;
}
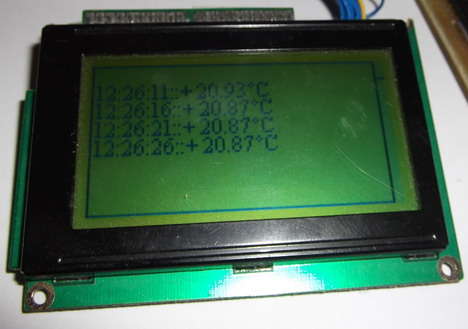
Date and time values are displayed along with temperature values on the main LCD screen.

Other functions
Navigation on the temperature sensor is made through an uncomplicated menu. It consists of five menu elements: time and date change, log view, stats view, clear stats, and graph view.
First of all, time and date change function. It simply allows to cycle around all time and date elements one by one and selects one to change. With a rotary encoder wheel, the turn value is updated immediately.

Log view function allows displaying temperature values row by row every 5 seconds. It may be convenient to track temperature change during time.
Stats function displays min and max temperature values stored in EEPROM. In contrast, the clear stats function clears these values that make them record from the current date. The date is also stored to know the time when stats were started to collect.

And finally, the Graph view function plots temperature values every 5s on a simple graph. There are no labels on the axis – trace with the current temperature indicator.

As mentioned above, AVR also sends temperature values via USART so they could be seen in the terminal window:
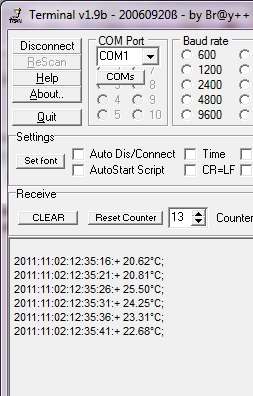
The project is still not polished. Code is messy and not optimized. I hope you’ll find it interesting.