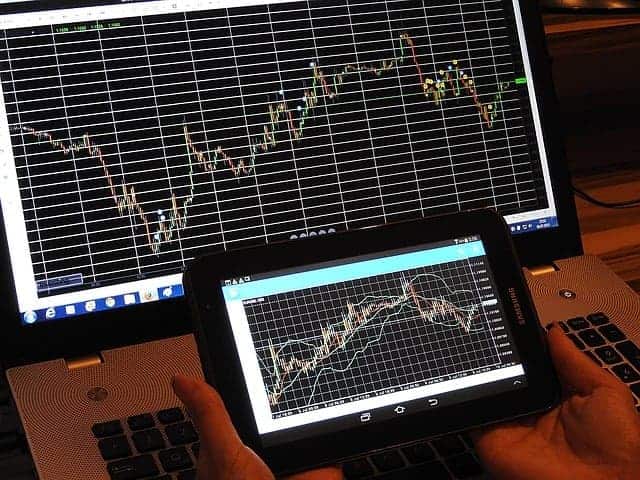
Around the millennium turn, Forex trading was seen as almost a black art, accessible only to those who understand its mysterious ways, with its own special language, acronyms and even hand signals. Today, if the internet is to be believed, everyone is at it.
You might say that is unsurprising. After all, in the technological age, most of us are a great deal savvier about all sorts of topics than we were 20 years ago. And let’s face it, in the wake of the global recession, we have had to bone up on a whole range of alternative investment strategies. These days, half of us have become property tycoons almost by accident due to the pensions crisis. Is it any wonder if the other half is becoming Forex traders?
Perhaps not, but what is certainly a sobering thought is that according to some media sources, an overwhelming majority of new traders are making a terrible failure of it. The reason is not due to any fault in the market – Forex trading is one of the safest and most reliable forms of investment – far more so than stocks and share. It is simply the age-old problem of fools rushing in where angels fear to tread.
The very fact that the Forex market can be so lucrative is what causes the downfall of many a would-be trader. There was a reason those traders of old were looked on with the reverence of alchemists or magicians. Although the internet has opened up the possibility of Forex trading to a wider audience, there is no way you will succeed unless you understand at least the basic indicators that underlie the art.
SMA Indicator
The simple moving average indicator is one of the most basic yet effective tools at your disposal. It smooths out short-term fluctuations to provide a clear view of overall trends. Of course, this begs the question of what is meant by “short term.”
This depends entirely on the time window in which you are trading. You might use an SMA to take an average over 10 minutes, or you could use it for over three months. The point is that it adjusts your graph into the context of your trading activity, to eliminate the “background noise” of short term peaks and troughs that are irrelevant to your frame of reference.
On Balance Volume Indicator
When it was developed back in the 1960s, this indicator was seen as completely out of the left field. Today, the on balance volume indicator is one of the essential tools that every trader keeps an eye on. The rationale behind the tool is that a volume change precedes a price change, so watching one is indicative of the other.
As a leading indicator, the OBV needs to be read in the context of lagging indicators which could either exaggerate or counteract its effect. By adding a moving average to the OBV, you can gain a clearer view of any breakout – already, you can see how these indicators can work together to inform your trading.
MACD
It might be pronounced like the world’s favorite burger chain, but the MACD indicator has nothing to do with fast food and everything to do with making the right decision about buying or selling. The acronym stands for Moving Average Convergence Divergence, and the tool is used to confirm trends that might have been identified by the indicators we have already discussed.
It first measures the difference between two smoothed moving averages. The resulting metric is then itself smoothed, and compared against a moving average. By examining this, upward or downward trends can be confirmed. The MACD indicator is one of the most popular tools to use as a double check before making a critical buy or sell decision.
RSI
Overbought or oversold tools are used to decide whether to follow the herd when a major buying/selling trend emerges, or to hold back and see if the conditions become even better before making a move. A few indicators help here, but the best-known one is the relative strength index (RSI).
Again, this is time-dependent, but the most common is the three days RSI. The indicator looks at the cumulative sum of up days and down days experienced over a three day period. It uses this to produce a numerical value between zero and 100. If the price action has been completely up, it will give a result of 100, and if it has all been on the downside, it will approach zero. An index of 50 is neutral.
Bollinger bands
The final indicators worth mentioning are Bollinger Bands. These indicate market volatility, providing valuable insight on when to buy or sell. When Bollinger bands are far apart, it indicates high volatility, closer together means stability. However, the most interesting thing for traders is to jump in when the value of an asset tends towards the edges of the bands, as this suggests something out of the ordinary is occurring, and it could be time for action.


