Usually, one solution of debugging is to run compiled code on a PC simulator. You can download a limited version of the instruction set simulator from Hitex for free. Of course, better simulators aren’t for free. More advanced simulators you can purchase at Keil. More advanced, I mean that there is the ability to simulate peripherals by additional scripting and so on. But again, simulators are virtual tools, and usually, it is hard to simulate real-world events.
Once you face this problem, you are going to switch to real-world simulation using JTAG.
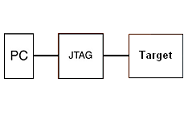
ARM7 microcontrollers come with JTAG (Joint Test Action Group) debug port. JTAG allows controlling ARM MCU using PC via a relatively cheap JTAG adapter.
JTAG 14 and 20 pin headers
JTAG usually allows to:
- download compiled code into on-chip RAM or FLASH and gives run control;
- view and modify memory locations;
But with JTAG is not possible to get any information while code is running. If you want to get some debug information, you have to halt the code execution. So true real-time debugging is not possible. And of course, the JTAG debugger is limited by MCU debug port resources. For instance, ARM7 JTAG has only two breakpoint registers. Controlling debugging depends on debugging software, where clearing/setting of breakpoints is done on the fly. Thus you can get pseudo-real debugging.
In some ARM microcontrollers like the LPC series, there are Embedded Trace Modules (ETM) included. ETM is a second debugging port which exports program flow information. ETM provides more powerful debugging capabilities like real-time trace, triggering, and performance analysis. ETM allows extensive code verification and software testing, which simple JTAG cannot do.
Of course, you can always add some debug kernel in to chip when on breakpoint can redirect the program counter to vector, where debug kernel is located. The kernel may upload required variables from selected memory to debugger via JTAG and return to application code. But again, it is not real-time debugging.


